LOS ANGELES, SOCAL, COMPREHENSIVE TRAIN MAP, 2026
May 16, 2026, Alan Waxman, Cal Poly Pomona
right click on the image to save and download the full size comprehensive train map:

Rolling at 10 mph with a chrome grille and the family cushioned on plush pink leather – this is a fitting use of the automobile. I’m sure this is why cars, even 19th century carriages, were invented (1). Pull into a gravel driveway beside dark leaves and glistening orange fruit, wet with morning dew. Dance up the old willow-shaded path to your ranch house sweetened by laughter and the scent of rosemary and sage. But is the automobile dream powerful enough to convince you to commute hours every day, shuttling along in thick traffic, baking, rushing in a little steel box? And what if there are no orange trees, no sage, no willow shaded path; only the drudging, gray freeway on and on to the office…
NEVER GIVE UP
Never give up the grille, the trees, the path. There just happens to be a better way to commute. You can relax, work at a table, eat a meal — you can commute by rail.
2026 SoCal metro area has
67 metrolink commuter rail stations
112 metro subway stations
29 Amtrak stations
62 San Diego light rail stations
270 total stations in SoCal in 2026
Approx 24 mil people
90k people per station
1945 SoCal metro area has (approximate)
1000 Red Car Stations or stops
Significant numbers of Yellow Car trolley stations
40 ~ Southern Pacific stations
30 ~ Union Pacific stations
SoCal Area 3.5 mil people
3,500 people per station
2026 NYC metro area has
250 commuter rail stations
472 subway stations
8 Amtrak station
730 total total stations in the NYC Metro area in 2026
Approx 20 mil people
30k people per station
1945 NYC metro area (approximate)
500 NYCRR stations or stops
500 PRR stations or stops
159 LIRR stations
30 New Haven line stations
40 DL&W line stations
50 CNJ stations
50 Erie Stations
11 H&M stations
20 NYS&W stations
15 O&W stations
40 SIRT stations
1400 total
NYC metro area 7.7 mil people
5,500 people per station
(2) links to statistics on stations
Cut the car and gas from $800/ month to $300 in tickets. Spend that extra money on lattes, Disneyland, or rent. Enjoy chatting, reading, or doing whatever you like — other than being stuck in traffic. Even enjoy a moment doing nothing at all.
DO WE RIDE OR DRIVE?
The most influential shift towards an easy commute by rail is actually our increasing cell phone use. The UX “dashboard” has replaced the “analog” dashboard.
Driving fatalities in the USA are already extremely high, around 13 per 100,000 people, per year (3), significantly higher than the homicide rate, which is around 5 per 100,000 people (4). Your chance of dying by gun violence as part of a gang while living in a high risk neighborhood is about the same as your risk of dying by driving in the suburbs, even higher in the exurbs (5).
Ubiquitous phone use may raise these numbers, with studies indicating that driving while talking on the phone or driving while texting causes fatalities equivalent to being drunk (6). As “work” and “home” have increasingly become blurred, the commute becomes fair game for that one extra call, text, or email. We are increasingly pressured to make use of this time. This would be easy on the rails, or in a bus; but off the rails — we go off the rails.
It is valuable to compare our present with that in the 1950s, when civic transport was at its height. Then, many enjoyed driving automobiles for recreational use, while most commuting was by rail. In the 1950s, shared civic transport use was at a height of 25 billion rides per year. If each of these rides averaged around 3.7 miles (7), this adds up to around 93 billion miles.
In 1955, there were 603 billion vehicle miles travelled of which 488 were cars 111 were truck and 4.5 were bus miles (8). It may appear that this means there were 5 times as many automobile miles being driven than train or bus miles ridden, but when we account for the fact that many people use each train or bus mile, it is evident that civic transport at that time was a much higher ratio of total personal travel. One bus can replace 30-some cars, or more (9). One train can replace hundreds of trucks of freight and dozens, or even hundreds, of cars. Imagining (conservatively) that those 93 billions miles of civic transport each replaced about 30 cars or truck miles, they add up to about 2.8 trillion miles replaced. It becomes immediately clear that, in the 1950s, many people used civic transport.
Download
article

Redrawn 1912 map Pacific Electric Railway, Red Lines, in Los Angeles vicinity (10)

1912 Pacific Electric Railway, Red Lines, historic map (11)

1935 Los Angeles Railway Corp map of the Yellow Lines downtown (12)(13)
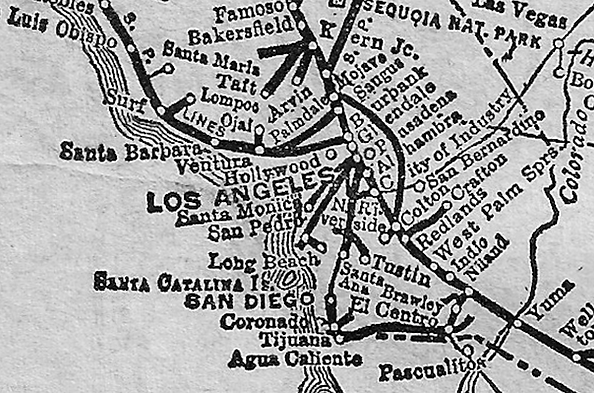
Picture of Southern Pacific lines in Southern California (14)

Los Angeles to Salt Lake City via Las Vegas, Union Pacific Rail lines in Southern California (15)
In 2020 there were 2.9 trillion private vehicle miles travelled (16). The US population has increased from 150 million in 1950, to 331 mil in 2020. At the same rate of vehicle miles travelled per capita as in 1955, the total would be approximately 1.2 trillion in 2020. Auto transport appears to have ballooned more than 2.4 times the rate of population growth. The shift is clear, in the 2020s, people ride cars about twice as much as they did in the 1950s. Nation wide, in the 1950s, at the peak of municipal rail and bus transport, people rode public transit about twice as much as in the 2020s.
Does this mean people in the 1950s were twice as civically minded? Not necessarily, however their lived experience did put themselves into civic transport spaces twice as much. The result of this shift from civic to private is massive, resulting in the proliferation of parking lots in downtown areas, and the spreading out of residential development according to the spatial needs of private transport.
As for cost, there is no competition between the asphalt roadway and the railway, both infrastructures are maintained in subsidies from your tax dollars, albeit more public subsidy goes to highways. The state spends $2.4 billion per year plus gas taxes for automobile roads, and even for the current “costly” high speed rail project, current construction expenditures have run about $1 billion per year (17). One fundamental difference is that for automobile infrastructure, we are asked to purchase a private car, with pretensions of personal assets, which depreciates as we are forced to continually pay for repairs and fuel. In our private car we are isolated, bearing more and more costs alone as we commute the car into the ground. The car also drives us into the ground. It is called a “whip,” after all. And the train? We participate in mobile civic space.
Crews are employed to make our day easier. Although an individual often doesn’t “own” the train, we all potentially own the train, and all can benefit from the civic space and freed up work and leisure time. This difference has wide ranging ramifications throughout the course of daily life, particularly in stress and safety.
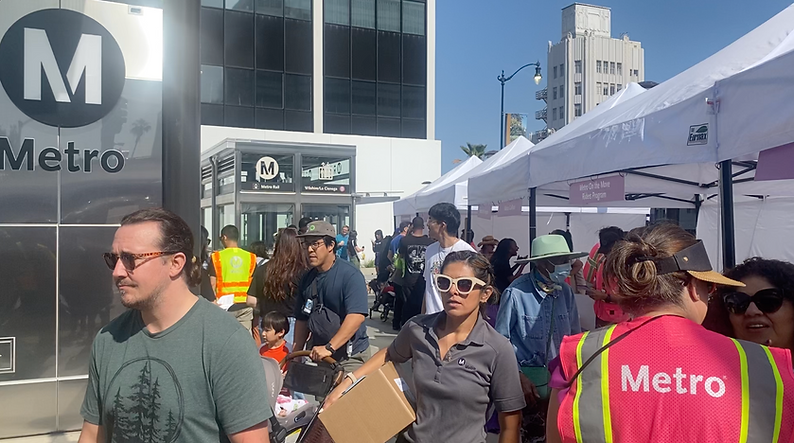
The opening of the new D line at Wilshire/ La Cienega, Beverly Hills, photo by author, May 8
CIVIC SPACE
Although civic transport use has rebounded, there was a drastic drop in the 1970s, resulting in an era of almost ubiquitous private car use (18). Put in the words of Joni Mitchell in 1970, “they paved paradise, put up a parking lot.” With the growth of parking lots, there was a loss of civic space that has only recently begun to be found again.
Civic space can be understood as generally safe, accessible space for the majority of the population; if we participate in a shared social contract in that space. While accessibility for vulnerable populations may indicate core drivers of the making of civic space, vulnerability can conversely result in extremely exclusive spaces such as institutional environments of social management and control of vulnerable populations. Conversely, civic space cannot be defined by spaces that are only accessible to a small number of people. For example, if a space is only accessible to individuals driving in their own vehicles, even if these vehicles are widely owned, they are privately owned, and the space is not public. A space that is only accessible to a particularly physically fit population, such as cycling lanes and cycling paths, also is not truly public. Car oriented spaces can lead to “car brain” or “motor normativity” (19) in which people often act in ways they would totally deem unacceptable in any kind of public or civic space.
Since the 1970s, public transit has rebounded (20), and along with it all kinds of civic spaces also proliferate. Spaces that are accessible if only for a small fee (like a coffee shop), or for no fee (like a train station, church, or hotel or casino lobby) may be considered civic even if they are not entirely free of social obligations. Social obligations and social contracts of some kind may actually be an essential part of what makes civic spaces civic. Buses and trains are perhaps the most frequented versions of these low cost civic spaces that come with some form of basic social obligation and decorum.
The “Nolli Map” is a well known historical example of mapped civic spaces in Rome, in which church naves are depicted as civic spaces along with streets and plazas (21). For such a map of Los Angeles, most streets would not be open “white” space because they are entirely inaccessible to most pedestrians. The streets would be black, with narrow white strips for sidewalks, and the interior of buses would be white. The inside of convenience stores like 7/11 or CVS would be white, but many inaccessible commercial lobbies would be black.

Nolli map, the area of St. Peter’s (21)
Such a “Nolli Map” of Los Angeles would include only several small islands and one large island of accessible space in downtown:
-
In and around Union Station, including the long area under the tracks and on the platforms, including Yaangna Park, El Pueblo plaza, Olvera Street, and some of the streets adjacent to this area, including the lovely parks and shrines beside the old Los Angeles Plaza Church.
-
The area of Chinatown and Broadway Street near Chinatown A station, as well as many of the smaller streets and parks adjacent to this and the Los Angeles Chinatown also known as New Chinatown.
-
Some of the Civic Center Mall. Often large areas are closed.
-
Little Tokyo Mall area and historic 1st Street, adjacent Arts District to SCI-Arc, then down past the site of the old Santa Fe La Grande Station (now apartments) to the 10 Freeway.
-
The jam packed pedestrian oriented shopping district by Los Angeles Street. This connects to the large island of pedestrian space that is Broadway, the Jewelry District, Pershing Square, Los Angeles Public Library, Maguire Gardens, and the interior and exterior sequences by the Portman designed Westin Bonaventura
Long singular conduits of accessible space are almost as bad as inaccessible private space. Very few pedestrians will venture more than 5 minutes along a single conduit such as a sidewalk unless it has branches or other accessible significance. A 5 min walk, about ½ of one kilometer, roughly a quarter of a mile, is the general pattern extant that most people will walk. All across the world, accessible “Main Street” like stretches of civic space are generally 1 kilometer wide, and take about 10 minutes to walk across. This is often known as the core area of the “15 Minute Neighborhood” (22).

15 min neighborhood diagram by DPZ CoDesign
With this ½ kilometer or ¼ mile filter, it becomes even more evident exactly where there is civic space, and why developers have already developed densified residential construction here or are planning on building densified residential construction here. The city forms a scattering of nodes of potential interaction linked together by trains and buses.
Being a participant in civic space requires civility and courteous recognition of others — but the unique thing about civic space versus private space is that civic space does not require saying or doing anything in particular. Non action is entirely normal, just sitting watching, lounging, observing, strolling, or walking quickly are all ok.
THE RENT IS TOO DAMNED HIGH
When we start to realize how much easier life is commuting by train and lounging about in civic space, even close to home, we begin to see how valuable it is to live near the train station. “Transit oriented development” just scratches the surface. We need real access to downtown civic life.
These key locations, what we might call walkable “Five Minute Neighborhoods” (and 15 Minute Neighborhoods) adjacent to train stations are often, unsurprisingly, extremely valuable pieces of property that have been hoarded by developers for years. Large sums of money have been made to turn these often dilapidated downtown parking lots and derelict semi-abandoned buildings into large, expensive apartment complexes. Although living in these buildings is often quite nice, and they claim to be partially affordable (23), these buildings are, at “market rate,” prohibitively expensive to all but a small slice of the city’s residents. Nor are they the densest form of housing.
Self built housing around the world is considerably more dense and more convenient (24). This is not to romanticize self built or “informal” housing. But, they are accessible. Often single or at most double or triple story, they can be adapted dynamically, and continually upgraded. Yet, they are largely prohibited by law in California, habitually removed by the police or considered a hazard.
It is becoming increasingly apparent that a new locally accountable model is needed. It must be dynamic and accessible enough for “user created” construction while ensuring health and safety standards.
Citations
1. The development of low riders appears to go back to 1831 in Santa Clara California. Waxman, Alan “Beyond The Carriage Window: A San Jose Arts and Crafts” in An Atlas For Land Back: Marginalization in a California Climate Area, 2025: 231-266.
2. Number of stations:
METROLINK, “Metrolink Fact Sheet, 2025-2026” 2026 accessed May 7. 2026 https://metrolinktrains.com/globalassets/about/agency/facts-and-numbers/fact_sheet_q2-fy26.pdf
Metro, “Metro Facts At A Glance” 2026, accessed May 7. 2026 https://www.metro.net/about/facts-glance/
kThor426, “r/MapPorn,” Reddit, 2024, accessed May 7. 2026 https://www.reddit.com/r/MapPorn/comments/1ceuops/map_of_all_new_york_city_regionalcommuter_rail/
MTA, “Subway and Bus Ridership for 2023,” 2026, accessed May 7. 2026 https://www.mta.info/agency/new-york-city-transit/subway-bus-ridership-2023
AMTRAK, Amtrak Government Affairs, “Amtrak Fact Sheet, Fiscal Year 2023, State of New York” March 2024, accessed May 7. 2026 https://www.amtrak.com/content/dam/projects/dotcom/english/public/documents/corporate/statefactsheets/NEWYORK23.pdf
Wikipedia, “History of the New York City Subway” 2026, accessed May 7. 2026 https://en.wikipedia.org/wiki/History_of_the_New_York_City_Subway
The Pennsylvania Railroad, C.T. 1000, Philadelphia, May 1, 1945, accessed May 7. 2026 https://www.multimodalways.org/docs/railroads/companies/PRR/PRR%20CT%201000%20Stations%20&%20Sidings%205-1-1945.pdf
“The Long Island Rail Road Fare Zones” 1985 in, Bill Lipfert, Facebook Dec 23, 2024, accessed May 7. 2026 https://www.facebook.com/groups/1576908292628997/posts/3974851342834668/
The New Haven Railroad Historical and Technical Association 2024 “Shore Line (New York City NY - New Rochelle - Stamford, CT - Bridgeport - New Haven) Shoreliner® Article Index”
https://www.nhrhta.org/shoreline1
Wikipedia, “Category: Former Delaware, Lackawanna, and Western Railroad Stations” June 2, 2018, accessed May 7. 2026 https://en.wikipedia.org/wiki/Category:Former_Delaware,_Lackawanna_and_Western_Railroad_stations
Wikipedia, “Central Railroad” in Shibu Mamen, Facebook, Dec 14, 2024, accessed May 7. 2026 https://www.facebook.com/groups/TeamSanchari/posts/9411373485587038/
Wikipedia, “Erie Railroad,” Feb 9, 2026, accessed May 7. 2026 https://en.wikipedia.org/wiki/Erie_Railroad
Transit Maps “Historical Map: Hudson & Manhattan Railroad, c. 1950-1953” “Transit Maps: Who’s Up For A Game of Mornington Crescent” May 28, 2015, accessed May 7. 2026 https://transitmap.net/hudson-and-manhattan-1950/
Wikipedia, “New York, Susquehanna, and Western Railway,” May 15, 2026, accessed May 15. 2026 https://en.wikipedia.org/wiki/New_York,_Susquehanna_and_Western_Railway
Middletown & New Jersey Railway Historical Society, “The Middletown & Unionville Railroad,” accessed May 15. 2026 https://mnjrhs.wordpress.com/the-middletown-and-unionville-railroad-mu/
Wikipedia, “History of the Staten Island Railway,” May 15, 2026, Accessed May 15, 2026 https://en.wikipedia.org/wiki/History_of_the_Staten_Island_Railway
3. traffic fatalities 2020, 2021, 2022, 2023, 2024, 2025, average statistics by the National Highway Traffic Safety Administration
2020: 38,824, March 2, 2022 accessed May 7. 2026 https://www.nhtsa.gov/press-releases/2020-traffic-crash-data-fatalities
2021: 42,915 March 2, 2022 accessed May 7. 2026 https://www.nhtsa.gov/press-releases/early-estimate-2021-traffic-fatalities
2022: 42,795 April 20, 2023 accessed May 7. 2026 https://www.nhtsa.gov/press-releases/traffic-crash-death-estimates-2022
2023: 40,901 IIHS HLDI “Fatality Facts 2023, State by State” July 2025 accessed May 7, 2026 https://www.iihs.org/research-areas/fatality-statistics/detail/state-by-state
2024: 39,345 April 8, 2025 accessed May 7, 2026 https://www.nhtsa.gov/press-releases/nhtsa-estimates-39345-traffic-fatalities-2024
2025: 36,640 April 1, 2026 accessed May 7, 2026 https://www.nhtsa.gov/press-releases/traffic-deaths-2025-early-estimates-2024-annual
4. Homicide rate 2020, 2021, 2022, 2023, 2024, 2025, average, FBI Crime Data Explorer accessed May 7, 2026 https://cde.ucr.cjis.gov/LATEST/webapp/#/pages/explorer/crime/crime-trend
5. IIHS HLDI “Fatality Facts 2023, Urban/rural Comparison” July 2025 accessed May 7, 2026 https://www.iihs.org/research-areas/fatality-statistics/detail/urban-rural-comparison
6. Strayer, D et al “A Comparison of the Cell Phone Driver and the Drunk Driver” Hum Factors, Summer 2006 https://pubmed.ncbi.nlm.nih.gov/16884056/
7. An average transit ride in 2023 runs about 3.7 miles American Public Transportation Association, “2023 Public Transportation Fact Book” accessed May 7, 2026 https://www.apta.com/wp-content/uploads/APTA-2023-Public-Transportation-Fact-Book.pdf
8. 1955 603 billion vehicle miles travelled, historic:
US Department of Transporation Federal Highway Administration Jun 30, 2023, accessed May 7, 2026 https://highways.dot.gov/highway-history/interstate-system/figures-and-tables-first-progress-report-highway-cost-allocation#:~:text=Table%203%20compares%20vehicle%2Dmiles,34%20percent%20for%20passenger%20cars.
9. One bus can replace 30 some cars or more Cars to buses Explain XKCD, “2684: Road Space Comparison” Oct 29, 2025 accessed May 7, 2026 https://www.explainxkcd.com/wiki/index.php/2684:_Road_Space_Comparison
10. Pacific Electric Railway in Los Angeles Vicinity
Foundry, “Route map of the Pacific Electric Railway - LA and Vicinity” 2026, accessed May 7, 2026 https://foundry.co/products/los-angeles-street-car-map-vintage-california-transport-la-rail-map-los-angeles-subway-overground-map-los-angeles-california
11. 1912 Pacific Electric Railway map Lowe
Pontius, D. W. “Lines of the Pacific Electric Railway in Southern California.” [California]: for Pacific Electric Railway, 1912. 19.25” x 24.125” with margins. In James E. Arsenault & Company 2026 accessed May 7, 2026 https://www.jamesarsenault.com/pages/books/3767/d-w-pontius/lines-of-the-pacific-electric-railway-in-southern-california?soldItem=true
12. 1935 Los Angeles Railway Corp map of Yellow Lines Downtown
Metro Art, “Los Angeles Railway Corporation (LARy) route map covering electric car and bus routes, 1935, front view.” Nov 10, 2022 accessed May 7, 2026
https://art.metro.net/artworks/exhibitions/yellowcar-la/attachment/1935-lary-system-map-front_30x40/
13. Redrawn maps of Yellow Lines and Red Lines
Tundria.com “LOS ANGELES CALIFORNIA, UNITED STATES July 1941” accessed May 7, 2026 http://www.tundria.com/trams/USA/LosAngeles-1941.shtml
14. “Southern Pacific Railroad 1969” in Burns, Adam, Southern Pacific Railroad: Map, History, Logo Last revised: October 16, 2024 accessed May 7, 2026
https://www.american-rails.com/sp.html#gallery[pageGallery]/0/
15. Union Pacific Rail, “The San Pedro, Los Angeles and Salt Lake Railroad Route Map Union Pacific” as pictured in Ebay by Old_West_Railroads, 2026, accessed May 7, 2026 https://www.ebay.com/itm/197254684186
16. In 2020 there were 2.9 trillion private vehicle miles travelled Vehicle miles travelled and car ownership:
Sunquist, Eric, Chris McCahill, University of Wisconsin-Madison, State Smart Transportation Initiative, March 16, 2026 accessed May 7, 2026 https://ssti.us/2015/03/16/for-the-first-time-in-a-decade-u-s-per-capita-highway-travel-ticks-up/
17. US Department of Transportation, “Trump’s Transportation Secretary Sean P. Duffy Pulls the Plug on $4B for California High Speed Rail’s Train to Nowhere”July 16, 2025, accessed May 7, 2026 https://www.transportation.gov/briefing-room/trumps-transportation-secretary-sean-p-duffy-pulls-plug-4b-california-high-speed
18. There was a drastic drop in all civic transport in the 1970s and almost ubiquitous private car use:
Potter, Brian, “How the Car Came to LA,” Construction Physics, August 10, 2023, accessed May 7, 2026 https://www.construction-physics.com/p/how-the-car-came-to-la
19. Delahanty, Ray, “Car Brain Is Real, and Civilization Is Worse For It” City Nerd, Jan 7, 2026, accessed May 7, 2026 https://m.youtube.com/watch?v=wVjx3ZFvfk8
20. Elkind, Ethan, PBS SoCal, “From Rail to Roads and Back Again: The Rebirth of L.A.'s Public Transit” March 16, 2022, accessed May 7, 2026 https://www.pbssocal.org/shows/lost-la/from-rail-to-roads-and-back-again-the-rebirth-of-l-a-s-public-transit
21. Nolli, Giambattista “La Nuova Topografia di Roma,” 1748 in Stanford.edu accessed May 7, 2026 https://web.stanford.edu/group/spatialhistory/nolli/
22. Duany, Andres, Steuteville, Robert, “Defining the 15-Minute City,” Public Square A CNU Journal Feb 8, 2021 accessed May 7, 2026 https://www.cnu.org/publicsquare/2021/02/08/defining-15-minute-city in “The 5-Minute Neighborhood, 15-Minute City, and 20-Minute Suburb” DPZ CoDesign May 9, 2023 accessed May 7, 2026 https://www.dpz.com/the-5-minute-neighborhood15-minute-city-and-20-minute-suburb/
23. Los Angeles Housing Department, “Affordable Housing Linkage Fee Background” 2025, accessed May 7, 2026 https://housing.lacity.gov/strategic-engagement/affordable-housing-linkage-fee-background
24. Camargo Sierra, Angelica Patricia et al “Understanding urban densification in Latin American cities: determinants of the production of built space in informal areas in Bogota (2007-2018)” Cities, May 2024, https://www.sciencedirect.com/science/article/pii/S0264275124000532,
density is related to convenience and vehicular miles traveled Boarnet, Marlon G, and Andre Comandon “Residential Density” Policy Brief, California Air Resources Board, April 2025 https://ww2.arb.ca.gov/sites/default/files/2025-05/Residential%20Density%20-%202025%20Policy%20Brief.pdf